Featured Project
Hospital Emergency Room Dashboard
Technologies Used
MS Excel
CSV
Project Overview
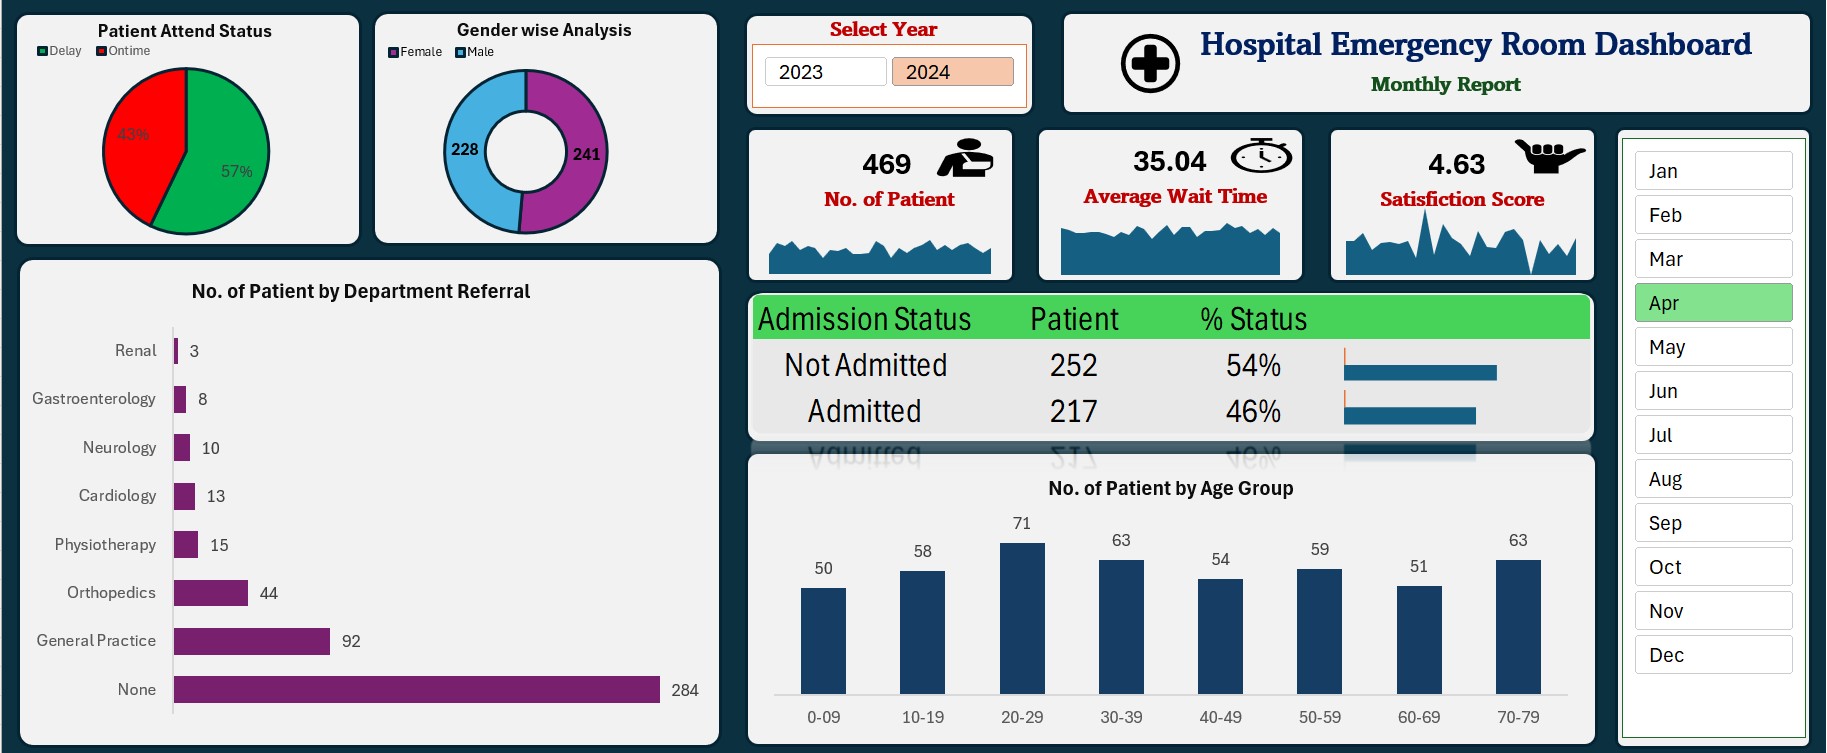
🏥 Hospital Emergency Room Dashboard
An interactive end-to-end dashboard designed to analyze and visualize key performance indicators (KPIs) for a Hospital Emergency Room (ER).
📌 Project Overview
The dashboard provides actionable insights into patient flow, wait times, satisfaction levels, and referral patterns in the ER.
It is built with MS Excel (can also be adapted to Power BI / Tableau), and leverages interactive visualizations to assist healthcare management in decision-making.
🎯 KPIs & Features
The following KPIs and charts were implemented:
Number of Patients
Daily ER visits
Trend analysis with area sparkline
Average Wait Time
Average time patients wait to see a medical professional
Trends to identify bottlenecks
Patient Satisfaction Score
Average daily satisfaction rating
Spot drops in satisfaction & link to busy times
Patient Admission Status
Admitted vs. Not Admitted
Patient Age Distribution
Group patients by age brackets
Timeliness
Percentage of patients seen within 30 minutes
Gender Analysis
Number of male vs. female patients
Department Referrals
Most common referral departments
📊 Insights & Findings
Peak ER traffic identified during late evenings.
Wait times are longer on weekends, requiring staffing adjustments.
Satisfaction scores drop during peak hours, indicating service bottlenecks.
Pediatrics and Cardiology are the most referred departments.
Timeliness metric showed only 68% of patients were seen within 30 minutes – improvement opportunity.
🛠 Tools & Technologies
MS Excel for dashboard & visualization
Excel / CSV dataset for ER data
DAX measures for KPI calculations
📌 Future Enhancements
Integrate real-time hospital data feeds
Add predictive analytics for patient inflow forecasting
Develop automated alerts for high wait times or low satisfaction scores
🙌 Acknowledgements
Special thanks to Satish Dhawale for providing the KPI requirements and inspiration for this project.
Key Features
- Modern & Responsive Design
- Clean Code Architecture
- User-Friendly Interface
- Cross-Platform Compatibility
- Performance Optimized
Project Links
Project Highlights
Clean Code
Architecture
Responsive
Design